Systems Thinking Foundations
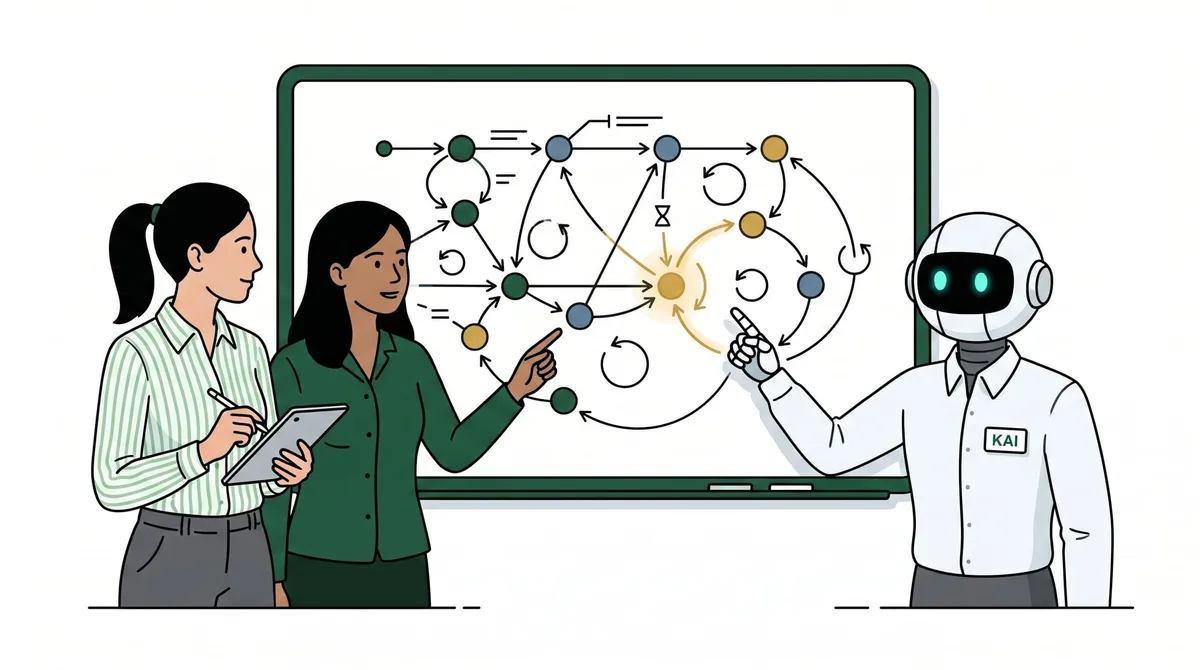
At Admire, we use systems thinking on every problem.
It is how we avoid treating problems as isolated events. We use systems thinking to ask: what structure keeps producing the problem?
At our prior company, Galvanize, we learned that many issues are not single part failures. One of our teams could have talented people, effective tools, and good intentions, yet still produce counter-productive behaviors and poor overall outcomes.
Without systems thinking we tended to optimize locally:
- Sales pushed for more bookings even if the ideal-customer-profile (ICP) fit wasn’t there.
- Product built unnecessary capabilities, delaying critical fixes.
- Finance tightened spend, blocking needed investments.
Each function can look reasonable in isolation while the whole system could still get worse.
Systems thinking gives leaders a shared vocabulary for this pattern. It helps you name elements like stocks, flows, feedback loops, delays, domains, leverage points, and worldviews before choosing a behavioral intervention.
Interactive primer
See the structure before choosing the fix
These small models cover the concepts leaders need most often: interactions, stocks and flows, feedback, problem domains, leverage points, and human worldviews.
01 / Core Paradigm
Performance lives in the interactions
Russell Ackoff's car parable makes the point quickly. If you choose the best component from each manufacturer and bolt them together, you do not get the best car. You get parts that were never designed to work together.
Does not fit. Local excellence does not guarantee a working whole.
02 / Stocks and Flows
A stock changes only when flows change
A stock is an accumulation. A flow is a rate that changes it. Drag the inflow and outflow controls and watch the level integrate over time. The level keeps rising as long as inflow exceeds outflow, even while you lower the inflow.
Rising: inflow exceeds outflow.
In business, a subscriber base is a stock. New sign-ups are the inflow, and churn is the outflow. Cash, inventory, headcount, and sales pipeline all follow the same shape.
Reinforcing loops
A result intensifies the action that produced it. These loops create compounding growth, compounding decline, and winner-take-more dynamics.
Balancing loops
A result counters the action that produced it. These loops stabilize a system near a goal, but delays can make the correction overshoot.
Feedback timing
Delays turn good intentions into oscillation
A delay is the lag between an action and its felt effect. When feedback arrives late, decision-makers over-correct, and a move toward a stable goal turns into oscillation that looks erratic but is structural.
The bullwhip effect: a small bump in demand makes each tier up the supply chain over-order, leaving everyone with excess. Or cutting marketing, which feels free for a quarter while the pipeline coasts, then sales fall off a cliff.
03 / Situation Type
Classify the domain before acting
Cynefin separates situations by the relationship between cause and effect. The wrong response pattern can make a hard problem worse.
Domain 1 of 5 / Sense / Categorize / Respond
Clear
Cause and effect are visible and stable. Use a known practice and keep execution clean.
Processing a refund, running payroll, or completing a standard onboarding checklist.
Domain 2 of 5 / Sense / Analyze / Respond
Complicated
Cause and effect are knowable, but expertise or analysis is needed. There may be several good answers.
Designing a pricing model, optimizing a delivery route, or building a financial forecast.
Domain 3 of 5 / Probe / Sense / Respond
Complex
Cause and effect can only be understood in retrospect. Run small experiments and let practice emerge.
Launching a new product, changing company culture, or entering a new market.
Domain 4 of 5 / Act / Sense / Respond
Chaotic
No useful cause-and-effect relationship is available in the moment. Act first to create enough order to learn.
A data breach, a checkout outage during peak demand, or a public communications crisis.
Domain 5 of 5 / Decompose / Assign / Re-enter
Disorder
It is unclear which domain applies. Break the situation apart before people default to their preferred playbook.
A cross-functional meeting where each group argues from a different definition of the problem.
04 / DRRT Method
Deconstruct, relate, recognize, test
DRRT is a cycle, not a pipeline. Each intervention teaches you something about the system and updates the next map.
Step 01
Deconstruct
Objective: Identify components, agents, boundaries, inputs, outputs, and the stocks that accumulate inside the system.
Discipline: Deconstruct to understand, not to isolate. Parts matter because of what they can do inside the whole.
For subscription churn, map the subscriber base, new sign-ups, cancellations, onboarding, support, billing, and product quality.
Step 02
Relationships
Objective: Trace how components interact and how one local decision changes the behavior of another part of the system.
Discipline: Look for reciprocal loops, not single causes. Feedback and delay are usually where the real story sits.
Weak onboarding creates confused customers, more support tickets, faster churn, less revenue, and less capacity to improve onboarding.
Step 03
Recognize
Objective: Move from isolated events to the recurring structures that keep producing those events.
Discipline: Name the pattern before choosing the fix. If the same issue returns every quarter, the system is teaching you something.
Repeated win-back discounts may be shifting the burden away from the root onboarding problem.
Step 04
Test
Objective: Intervene with small probes, measure quickly, and let the system show whether the map is accurate.
Discipline: Use safe-to-fail experiments when the domain is complex. The output of each test updates the next map.
Pilot a new onboarding checklist with 10 percent of new accounts and compare 60-day retention before scaling it.
05 / Leverage Points
Where you push matters more than how hard
Donella Meadows ranked intervention points from shallow parameter tuning to deep shifts in paradigm. Select each rung to compare the leverage.
Rung 1 of 8 / Relative leverage 100%
Paradigms
The shared mindset that gives rise to goals, rules, and structure.
Shifting from "we sell software licenses" to "we sell customer outcomes."
Rung 2 of 8 / Relative leverage 90%
Goals
The purpose the whole system is actually optimizing toward.
Changing the goal from "growth at all costs" to "durable growth."
Rung 3 of 8 / Relative leverage 80%
Self-organization
The system's ability to learn, change, and evolve its own structure.
Letting teams adjust their operating model when the market changes.
Rung 4 of 8 / Relative leverage 66%
Rules
The incentives, constraints, and permissions in the system.
Paying sales teams on net revenue retention instead of only new bookings.
Rung 5 of 8 / Relative leverage 54%
Information flows
Who can see what, and how quickly the feedback reaches the person making the decision.
Giving every team a live view of churn, support load, or cloud spend.
Rung 6 of 8 / Relative leverage 42%
Feedback loops
The strength of balancing loops and the gain of reinforcing loops.
A customer health signal that automatically triggers a manager review.
Rung 7 of 8 / Relative leverage 28%
Buffers and structure
The physical or procedural stock-and-flow structure, including delays and capacity.
Adding support capacity or raising safety-stock inventory.
Rung 8 of 8 / Relative leverage 14%
Parameters
The numbers people instinctively tune first, often with the weakest long-term effect.
Changing headcount by 5 percent or running a short promotion.
06 / CATWOE
Human systems run on worldviews
CATWOE, from Soft Systems Methodology, helps define a messy human system by naming customers, actors, transformation, worldview, owners, and environment.
C / Customers
Customers
The people who benefit from, or are harmed by, the output.
Systems integration: Defines the external boundary and the output feedback loop.
Diners get a meal. Restaurants may also be harmed if fees make the model unsustainable.
A / Actors
Actors
The people or nodes that turn inputs into outputs.
Systems integration: Shows whose micro-actions combine into the system's macro behavior.
Drivers, restaurant staff, support agents, and the dispatch logic.
T / Transformation
Transformation
The core change from input to output.
Systems integration: Names the value-creating interaction at the center.
A tap on "order" becomes a meal at the customer door.
W / Worldview
Worldview
The belief that makes the system meaningful to participants.
Systems integration: Surfaces the mental models that drive behavior and conflict.
One group sees convenience. Another sees an unsustainable fee structure.
O / Owners
Owners
Those with power to change, override, or shut down the system.
Systems integration: Identifies where goals and paradigms can be altered.
The platform's executives and board can change fees or policies.
E / Environment
Environment
The outside constraints imposed on the system.
Systems integration: Defines the pressures the system cannot ignore.
Labor laws, fuel costs, insurance, city traffic, and competition.
How to use the lens
Name the stock
What is building up or draining?
If a problem changes over time, something is accumulating or draining: trust, pipeline, cash, inventory, managerial attention, technical debt, customer frustration, or skill.
Move the conversation from symptoms to rates of change.
Map the loops
What keeps the pattern going?
Ask which behaviors reinforce the current pattern, which behaviors counteract it, and where the delay sits.
Watch for delayed effects that make people over-correct.
Classify the situation
What kind of problem is this?
Clear problems need execution. Complicated problems need expertise. Complex problems need small probes and fast sensing. Chaotic problems need immediate stabilizing action.
Use the response pattern that matches the domain.
Choose the leverage point
Where can a small change matter?
Changing a number is easy. Changing an information flow, incentive, rule, goal, or worldview often matters more.
The higher the leverage point, the more care the intervention requires.
What leaders should watch for
Local optimization is the first warning sign. If every team is winning its own metric while the customer or employee experience gets worse, the metrics are misaligned.
Repeated fixes are the second warning sign. If the same workaround returns every month, the workaround may be shifting attention away from the structural issue. Discounting to cover churn, hiring to cover unclear priorities, or escalating every decision to cover weak ownership can all become dependence loops.
Conflicting worldviews are the third warning sign. Many systems fail because the people inside them are not working from the same assumptions. One group sees speed. Another sees risk. Another sees quality. CATWOE, the Soft Systems Methodology checklist, is useful because it makes those worldviews explicit before the team debates solutions.
In each case the question is: what structure is producing this behavior? Once you can name the stock, the loop, the domain, and the leverage point, you can change the structure.